
Capital Gains Tax History: How Rates Changed Over Time
From the 12.5% rate of 1921 to OBBBA permanence: trace every major capital gains tax change, the holding period story, and what history predicts next.

Why Capital Gains History Matters
Capital gains have received preferential treatment since 1922, when the rate first dropped to 12.5 percent. The preference swung through 25, 28, 20, and 15 percent over nine decades before settling into today's 0, 15, and 20 percent structure, which the TCJA made permanent and OBBBA preserved.
Capital gains tax history explains why your investment account gets treated so specially today. The preferential rate you receive did not appear by accident at any point.
Congress has debated the same fairness questions for over a century now.
Understanding the historical arc also helps investors anticipate future direction. Rates have cycled between preferential and near-equal treatment several distinct times already.
Each cycle left behind specific rules that still shape returns today in visible ways.
This guide traces every major turning point from 1913 through the current 2026 system. Along the way it explains holding period rules, the exclusions, and the modern surtaxes.
Anyone who reads it will recognize the fingerprints of old laws on their own tax bill.
State systems followed their own quieter historical paths alongside the federal story. Most states simply copied the federal ordinary-income treatment for gains.
A few created their own preferences, and our state comparison post maps them all.
The Beginnings: 1913 to 1921
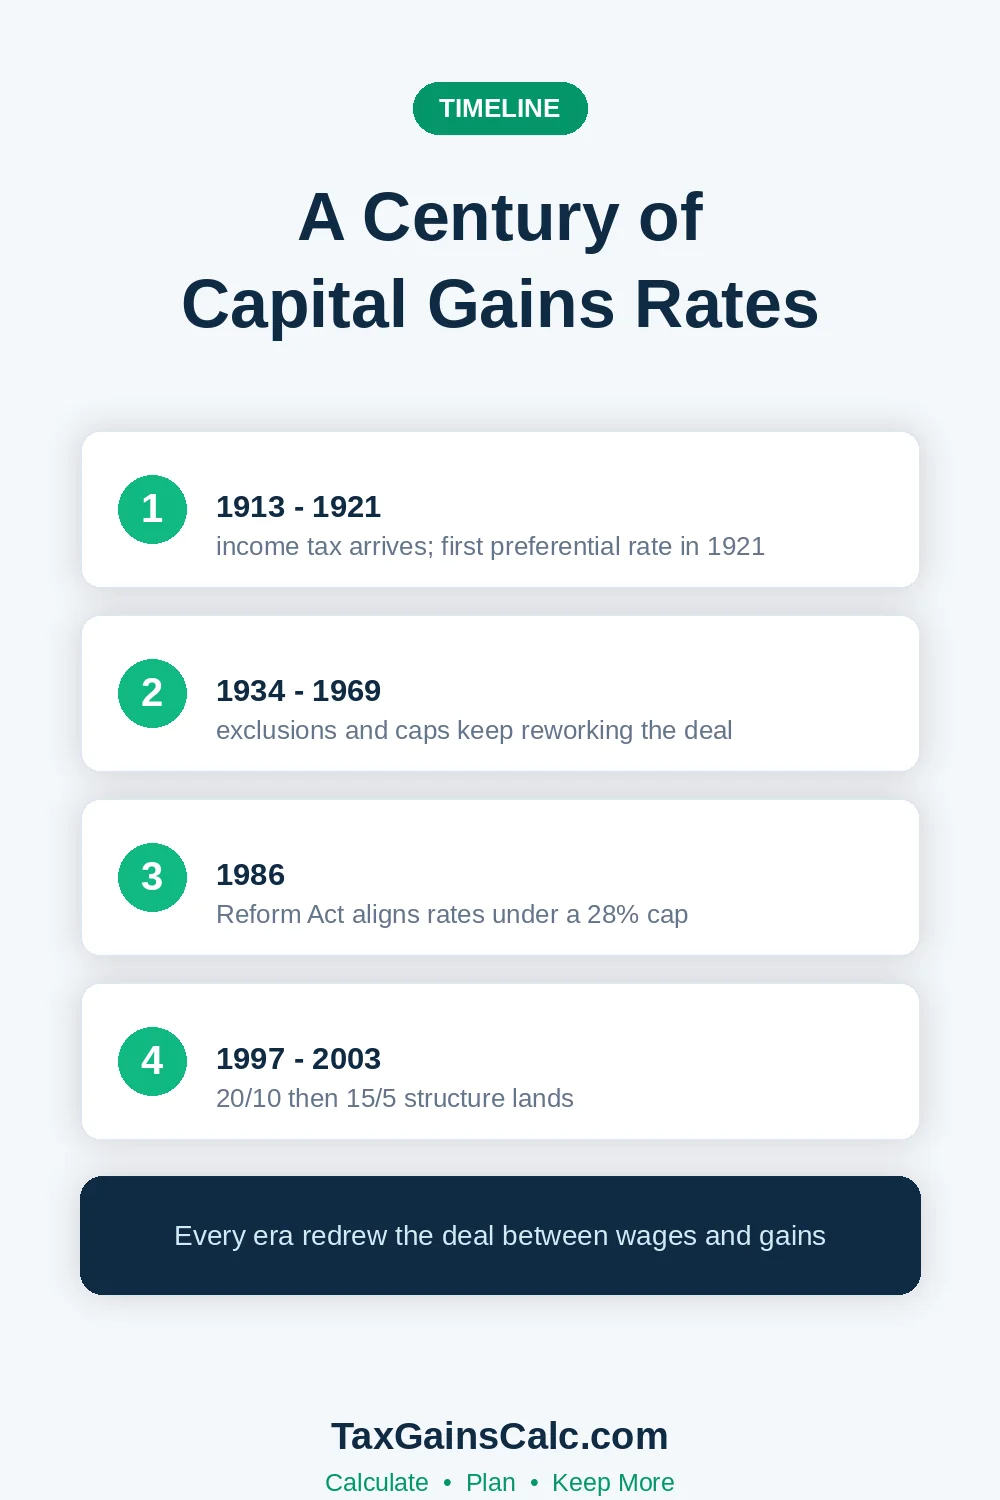 The modern federal income tax arrived with the Sixteenth Amendment in 1913. The earliest statutes taxed investment gains exactly like every other income source available then.
Top marginal rates quickly climbed toward 73 percent during the First World War era.
Selling anything became nearly unthinkable for wealthy holders facing that confiscatory ordinary rate then. Congress watched assets stay locked up while productive capital sat frozen.
The Revenue Act of 1921 answered with the first preferential capital gains rate.
That 1921 act taxed gains from property held longer than two years at just 12.5 percent. The visible gap between 73 percent ordinary and 12.5 percent preferential was staggering.
An American preference for long-held investment gains was born that year permanently.
Lawmakers justified the gap with a lock-in theory that still sounds familiar today. Taxing gains at ordinary rates, they argued, discouraged productive sales of growing companies.
The preference was designed to unlock capital markets, not simply to cut rich investors' bills.
Mid-Century Tinkering: 1934 to 1969
 The 1930s and 1940s layered graduated exclusions and alternative computations onto the base system. Only a percentage of long-term gains counted as income, depending on the gain size.
That famous 25 percent alternative rate capped the maximum effective burden for decades afterward.
| Year | Change | Long-Term Treatment |
|---|---|---|
| 1913 | Income tax begins | Ordinary rates apply |
| 1921 | First preference created | 12.5% for two-year holdings |
| 1934-1942 | Graduated exclusions | Up to 50% excluded, 25% cap |
| 1969 | Minimum tax added | Preference items taxed separately |
| 1978 | Steiger amendment | 60% excluded, 25% top effective |
The exclusion approach meant most long-term gain simply never appeared in taxable income. Sixty percent exclusions by 1978 produced a 25 percent maximum effective rate.
High earners paid that rate regardless of how steep their ordinary brackets climbed.
The holding period also shortened during this era, moving from two years to one. Shortening the qualifying period made the preference accessible to ordinary long-term investors. That one-year line remains the defining boundary in all of tax law today.
Mid-century investors navigated a maze of lookback rules and recharacterization provisions too. Certain transactions measured their holding periods against entirely different starting events. Cleaning up all those wrinkles took Congress several full decades of incremental refinement.
The exclusion percentages also shifted with every wartime revenue push during those decades. Revenue needs drove the short-term changes more than any coherent policy theory. That pattern of revenue-driven tinkering continues to this day in smaller forms.
The 1986 Revolution
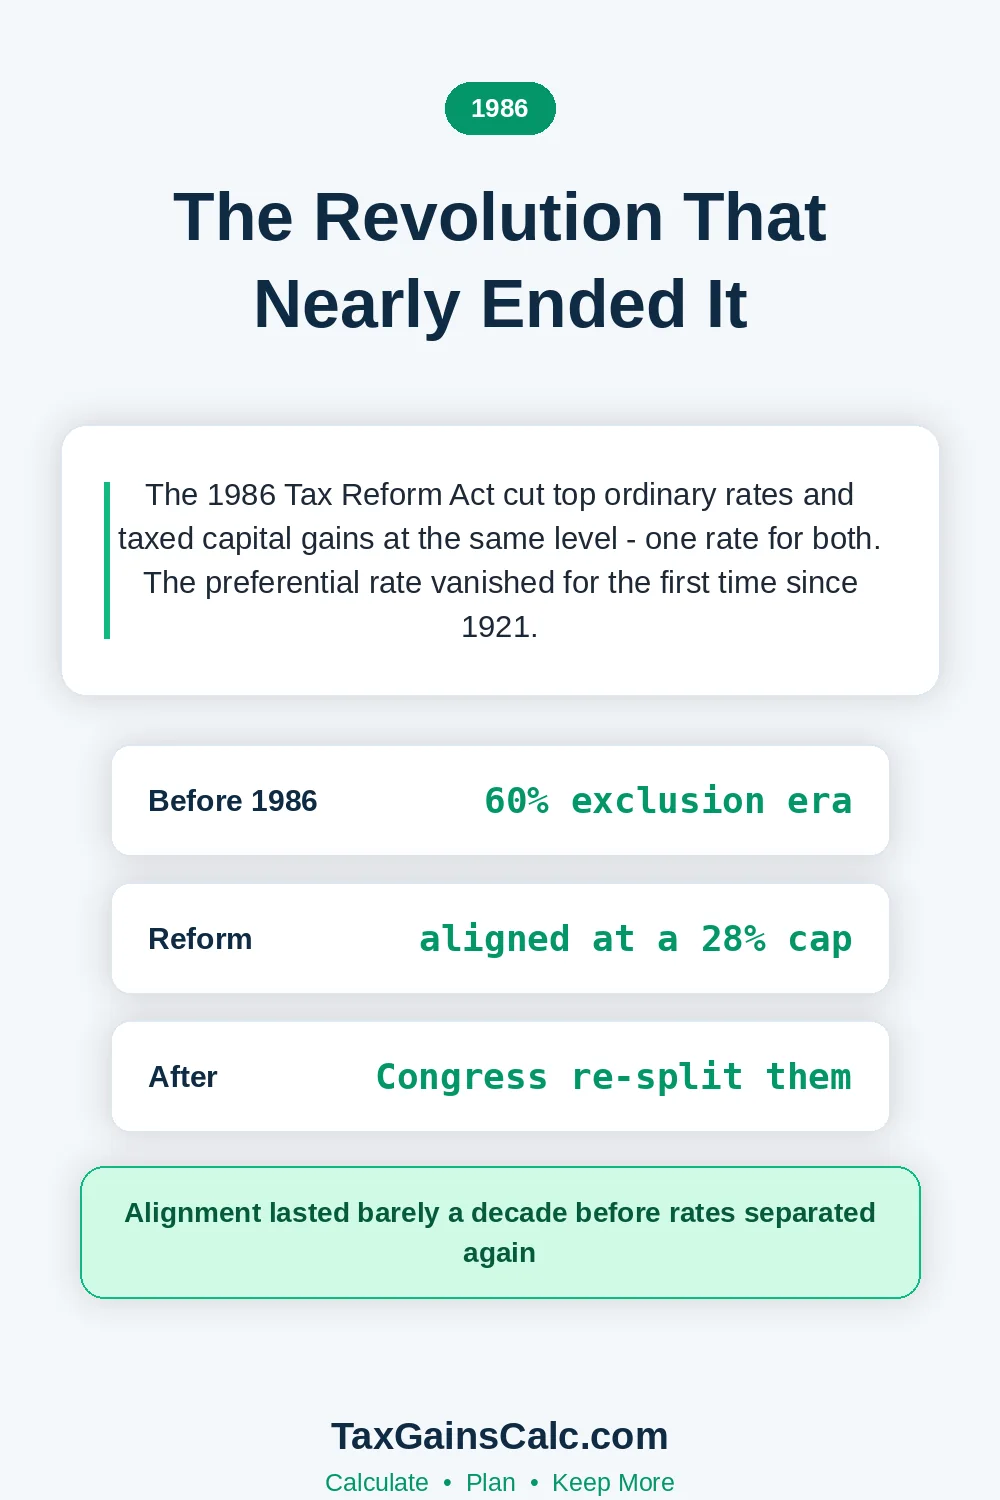
 The Tax Reform Act of 1986 did something nobody expected afterward. It eliminated the capital gains preference entirely and dropped ordinary rates dramatically. Long-term gains were taxed exactly like wages once the transition completed.
President Reagan signed the bill after Congress promised simplicity in exchange for fewer shelters. The top ordinary rate fell from 50 percent all the way down to 28 percent. With full equality restored, the old exclusion machinery became completely unnecessary overnight.
The equality experiment lasted barely a full decade before preferences crept back in. The 1990 and 1993 laws created a separate 28 percent cap for long-term gains. The modern three-bracket structure began assembling itself quietly in those exact years.
Investors who lived through 1986 describe the transition as genuinely disorienting. Rules changed mid-year and holding strategies built over decades lost their value. The episode remains the strongest argument for diversifying your tax timing decisions broadly.
Investors who sold everything before 1986 avoided the transition but missed later recovery. Investors who waited faced the new regime with no planning runway at all. Spreading realization decisions across years has outperformed concentrated timing bets historically.
The 1997 and 2003 Rate Structures
 Legislation from 1997, the Taxpayer Relief Act, reshaped the system investors recognize today. It created the 20 percent and 10 percent long-term rates for most common assets. It also shortened the qualifying holding period from eighteen months back down to twelve.
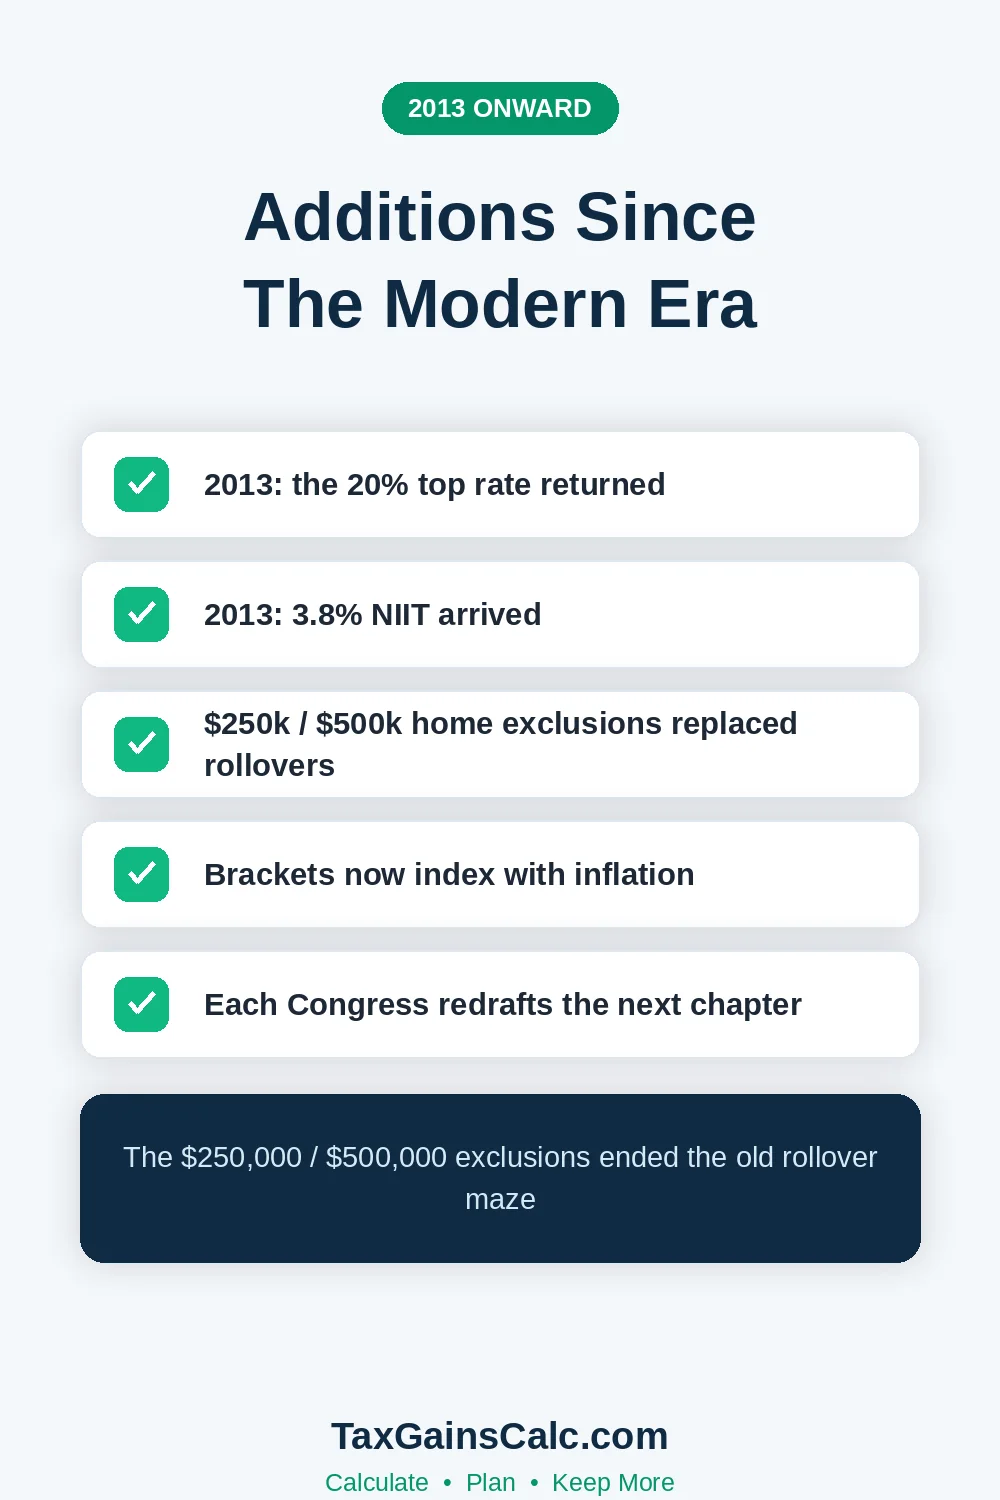
That act also delivered the home sale exclusion of Section 121 that families still rely on. Those fresh exclusions worth $250,000 and $500,000 replaced a truly confusing rollover system. Homeowners gained a permanent exclusion instead of endlessly paper-shuffling gains between houses.
The same 1997 act also created the first generation of education incentives. The tax code was becoming a social policy instrument as never before. Every later reform has inherited that expanded social role without ever officially admitting it.
The 1997 act also created Roth-style flexibility conversations that continue today. Each reform expands some accounts while leaving others untouched for decades. Investors who master the current account map always capture the advantages first.
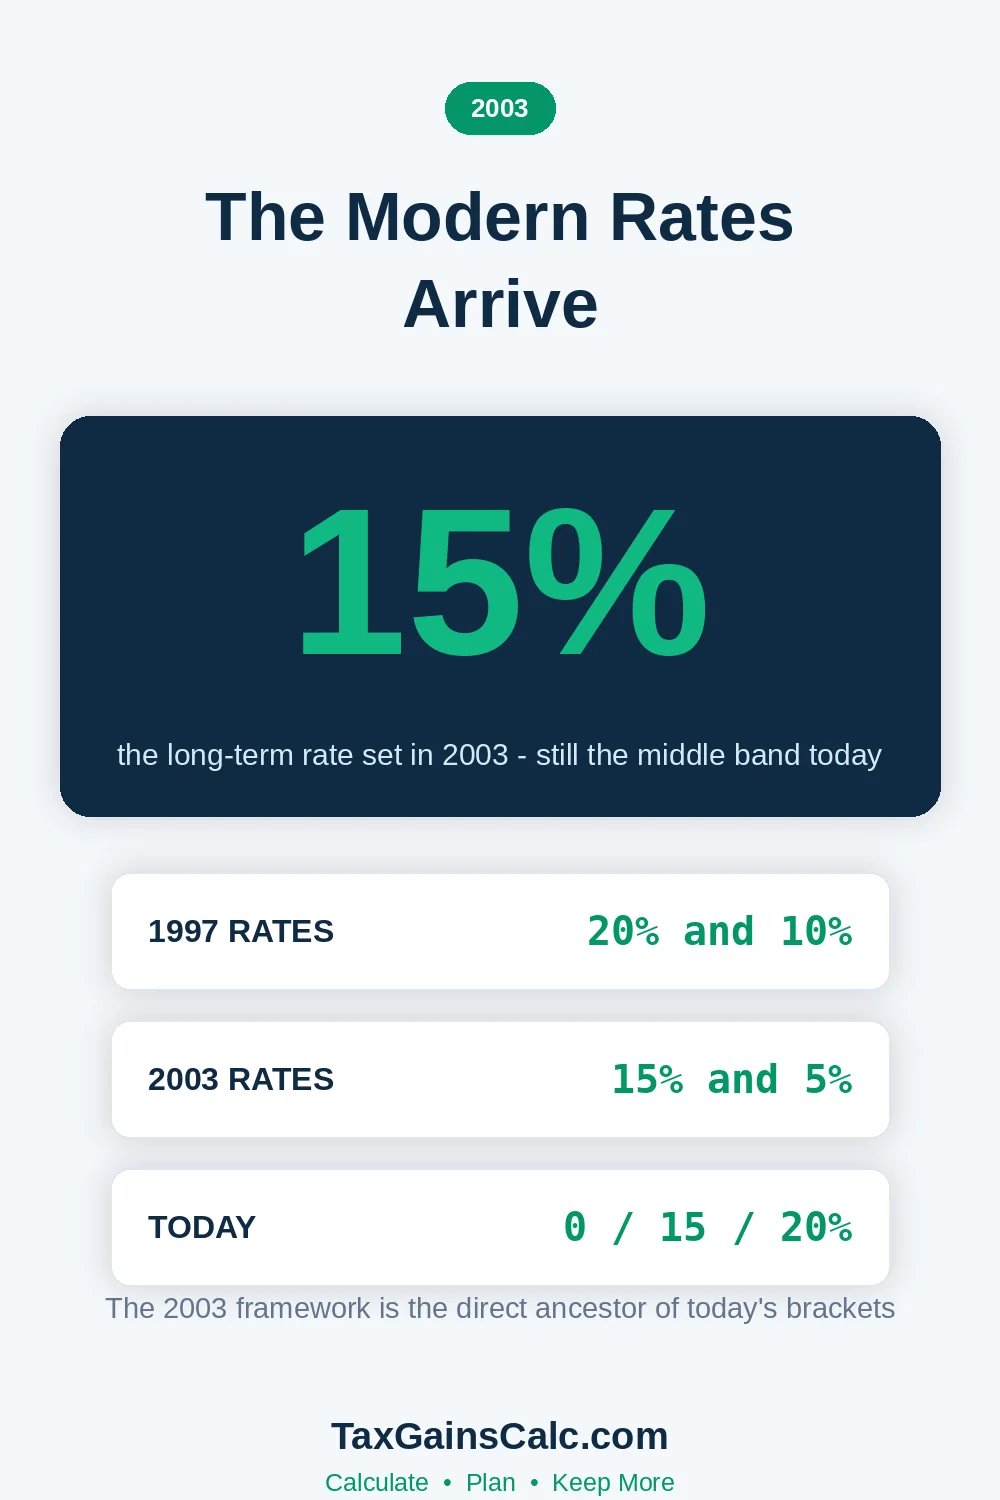
The Jobs and Growth Tax Relief Reconciliation Act of 2003 cut the top long-term rate again. The 20 percent rate fell to 15 percent while a new 5 percent band appeared. That 5 percent band dropped to zero percent in 2008 and became permanent policy.
| Rate Era | Top Long-Term Rate | Zero Bracket |
|---|---|---|
| 1987 through 1997 | 28% | None |
| 1998 through 2002 | 20% | 10% bottom band |
| 2003 through 2012 | 15% | 5%, then 0% from 2008 |
| 2013 through today | 20% | 0% up to indexed threshold |
The 2013 Surtax Arrives
The Affordable Care Act added a layer no earlier reform had attempted. A new 3.8 percent levy named the net investment income tax arrived for high earners in 2013. Singles faced a $200,000 threshold, joint returns a $250,000 one, and neither figure has ever indexed for inflation. Publication 550 details the modern investment income rules that grew out of this long experiment.
That statutory freeze means inflation quietly widens the surtax net every single year. Gains that never touched the surtax decades ago face it routinely now. Our NIIT guide covers the current mechanics in full.
Combined top rates climbed to 23.8 percent including the fresh surtax. Adding typical state taxes pushed the all-in burden toward levels unseen since the 1970s. The clear historical lesson is that tax layers, not headline rates, define the real bill.
TCJA and OBBBA Stabilize the System
The 2017 Tax Cuts and Jobs Act left all three long-term rates completely untouched. It instead indexed the ordinary brackets and kept the gain thresholds inflation-adjusted each year. Investors kept their familiar 0, 15, and 20 percent schedule through that entire reform.
The act did touch adjacent rules that indirectly affect gains each year. Pass-through deductions and bonus depreciation changed how business sellers structure exits. Those indirect changes often matter more to real working investors than headline rates.
Small business sellers gained the most from the OBBBA-era QSBS expansions. The tiered exclusion schedule rewards holders who plan exits years in advance. Our QSBS phase-in guide covers that opportunity completely.
Rate structures from the TCJA became permanent under the 2025 One Big Beautiful Bill Act. Before that law passed, a 2026 sunset threatened to raise every bracket automatically. Our OBBBA capital gains summary explains what changed and what stayed.
Permanence matters more for planning than any single rate level ever does. Multi-year strategies like installment sales and charitable trusts depend on genuinely predictable schedules. Our complete OBBBA guide walks through the durability questions thoroughly.
The Holding Period Story
The qualifying holding period has swung repeatedly across the last century. Two years in 1921 became six months during the 1930s and 1940s era. The line moved repeatedly before finally settling at twelve months back in 1977.
A brief experiment with eighteen-month qualifying periods appeared in the late 1990s. That complexity confused investors and was repealed within a few years. The twelve-month rule has held steady ever since, and few observers expect another change.
Wash sale and repurchase rules also evolved during this long settling period. Those guardrails prevent harvesting tricks from undermining the holding period distinctions. The current boundaries of those rules come through clearly in our wash sale guide.
The short versus long-term guide shows what the boundary is worth today. For investors in typical mid-brackets, that spread routinely tops ten full percentage points. History suggests that gap will persist through future reforms as well, whatever they bring.
Seniors and retirees have been consistent winners across most historical eras. Every rate structure since 1997 has kept a 0 percent band open to modest incomes. Our seniors guide applies the current rules to retirement planning.
Lessons Every Investor Should Take
The first lesson is that preferences survive politics longer than critics expect. Every major repeal attempt since 1921 failed to permanently eliminate the two-tier structure. Investors should still plan confidently around current rates without constantly fearing repeal headlines.
The second lesson concerns timing freedom inside long holding periods. Gains realized in different eras received wildly different treatments across the last century. Flexibility about exactly when to realize gains has always been worth real money.
The third lesson involves the quiet growth of exclusions alongside rate changes. The home sale exclusion, the QSBS rules, and opportunity zones all arrived during high-attention reforms. Smart investors monitor reform packages for new exclusions rather than only rate headlines.
The fourth lesson is that thresholds creep while headline rates look stable. The NIIT thresholds never indexed, and bracket indexes compound annually in different directions. Two identical investors a generation apart can face very different effective burdens.
The final lesson is to keep records that survive changing rules. Basis records from decades ago determine today's calculations no matter what changed since. Our basis methods guide and calculation walkthrough apply history to your own files.
What History Predicts About the Future
Every era of rate cuts eventually met a era of partial restoration. Budget pressures and political cycles have always driven the pendulum back eventually. Investors planning decades ahead should treat current rates as favorable but not guaranteed.
Proposals surface regularly for taxing gains at death or taxing unrealized appreciation. None have become law, but the ideas keep returning in different forms. Our 2027 bracket projections cover the known scheduled changes ahead.
Locking in gains during low-rate eras has historically rewarded patient and flexible sellers. The current rates breakdown helps time those decisions with real numbers. History never repeats exactly, but it certainly rhymes on a predictable schedule.
| Historical Threshold Type | Today's Rule | Origin |
|---|---|---|
| Holding period boundary | 12 months | 1977 return to one year |
| Home sale exclusion | $250,000 / $500,000 | 1997 Taxpayer Relief Act |
| Zero percent band | Indexed annually | 2003 act, effective 2008 |
| NIIT surtax | 3.8% fixed thresholds | 2013 ACA provision |
| Rate permanence | 0% / 15% / 20% | OBBBA 2025 permanence |
For beginners, the deepest historical lesson is simply to stay informed. For the system as it stands now, our beginner's guide explains everything minus the history. The IRS Publication 17 remains the best official starting reference each filing season.

Wasim Akram
Wasim researches and writes every article on TaxGainsCalc, covering capital gains tax for everyday investors. Every figure is checked against primary IRS sources before it goes live.