
The 15% Capital Gains Bracket: Income Limits 2026
Who pays the 15 percent capital gains rate in 2026: exact taxable income windows, stacking mechanics, the NIIT add-on, and planning edges that work.

The 15% Capital Gains Bracket: The Direct Answer
Most Americans who realize investment gains end up paying the 15 percent long-term federal rate. That rate applies across a wide middle band of taxable income for the 2026 tax year.
Single filers occupy the 15 percent band from $49,450 up to $545,500 of taxable income.
This guide maps the band precisely, shows how stacking works, and prices the add-ons.
Three planning edges separate a good outcome from a great one, and each one shows up at filing time. Filling the 0 percent band first, staying under the NIIT lines, and avoiding the 20 percent cliff.
Each edge gets its own worked section below, complete with dollar figures you can trace on your forms. Every section closes with the exact numbers for that move.
The Exact 2026 Band by Filing Status
Federal law sets exactly three long-term capital gains rates, and where your total taxable income lands decides which applies.
The bands reset every year with new inflation adjustments. The 0 percent band covers the lowest incomes before the 15 percent band starts.
Heads of household also get wider bands than single filers do, though the margin between them stays small.
Every boundary for the 2026 tax year sits in the table below, filing status by filing status. The joint band ends far higher than the other two.
| Filing status | 0% band ends | 15% band ends |
|---|---|---|
| Single | $0–$49,450 | $49,450–$545,500 |
| Married filing jointly | $0–$98,900 | $98,900–$613,700 |
| Head of household | $0–$52,950 | $52,950–$583,750 |
Those boundaries measure taxable income after deductions, not the gross wages printed on your W-2.
The standard deduction removes $16,100 on single returns and $32,200 on joint returns from the top. 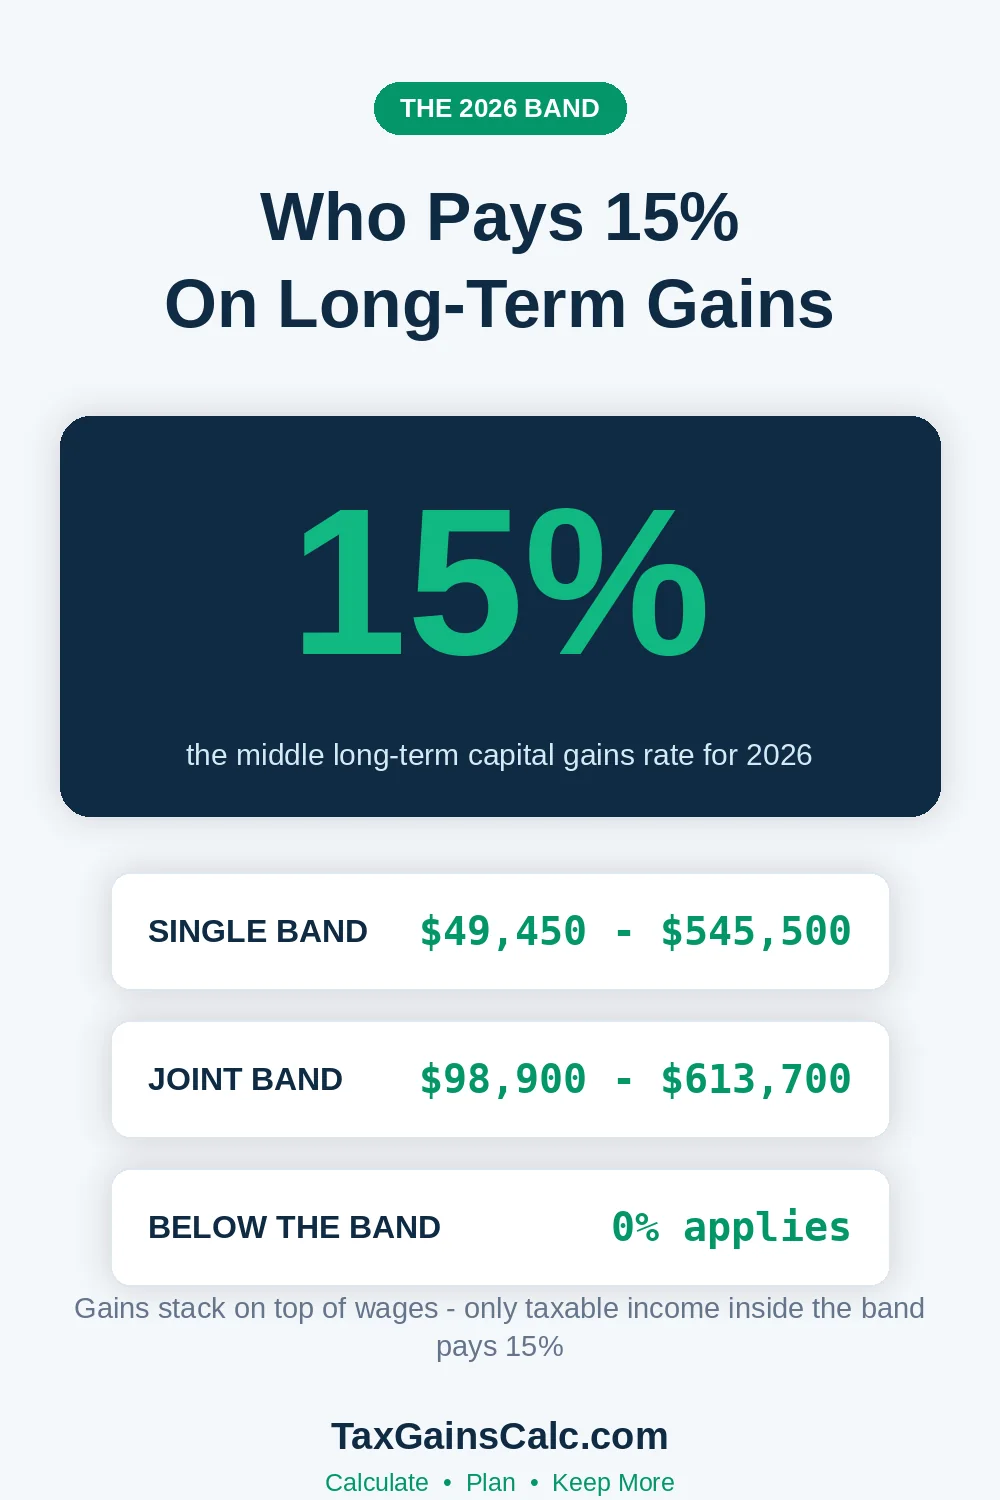 That subtraction comes off the top before any gain enters the picture. Both deduction figures reflect the inflation adjustments the IRS announced for 2026.
Your taxable income therefore lands well below your raw salary in most years, once those deductions come out. Pretax contributions and write-offs open that gap every single year.
Our thresholds guide shows the same boundaries with worked context.
How Wages and Gains Stack Inside the Bands
Gains pile on top of ordinary income as the IRS fills each band in order.
Wages, interest, and retirement withdrawals fill the bottom of your taxable income first.
Long-term gains then fill whatever band space the ordinary income left open above it, slice by slice.
Each piece inherits the rate of whichever band holds it. The slice-based math surprises people who assume the whole gain takes one rate.
Only the gain portion inside the 15 percent band actually pays 15 percent. Portions below the boundary pay 0 percent, and portions above pay 20 percent.
One sizable sale often stretches across two bands, and occasionally all three, on the same worksheet. Which bands it touches depends on the wages stacked underneath. Our bracket calculator guide walks the slice arithmetic precisely.
Worked Example: A Filer Inside the 15 Percent Band
Take one unmarried filer earning $60,000 of wages during the 2026 tax year when everything else stays flat. Once the standard deduction comes out, taxable income sits at $43,900 before any long-term gain enters the picture. The bands read that $43,900 figure, not the wages.
That leaves $5,550 of unused 0 percent band space sitting open above the wage income. Only the portion above $49,450 will ever owe federal tax. A $100,000 gain then shows up and splits cleanly across two bands, with the slice math settling the bill.
The first $5,550 of the gain lands inside that 0 percent zone and owes nothing at all. Everything above it, the $94,450 remainder, stacks into the 15 percent band just past that line. The split happens automatically once the slices land on the worksheet.
Add the two slices together and the total federal bill on this gain comes to roughly $14,168. None of the gain climbs high enough to touch the 20 percent band on this return. Every dollar of that total traces back to one of the two slices in the table.
| Gain slice | Band | Tax |
|---|---|---|
| $5,550 | 0 percent | $0 |
| $94,450 | 15 percent | $14,168 |
| total | blended | about $14,168 |
Now hand that identical $100,000 gain to a higher earner whose wages total $150,000 for the year. Those wages already overflow the 0 percent band, so no free room survives for the gain. The stack starts at 15 percent from the first dollar of gain.
The entire $100,000 gain therefore takes the 15 percent rate with no 0 percent slice to soften it. Higher wages simply crowded out the free band space the first filer captured for nothing. The math still lands at $15,000, all of it at 15 percent.
The NIIT That Turns 15 Into 18.8
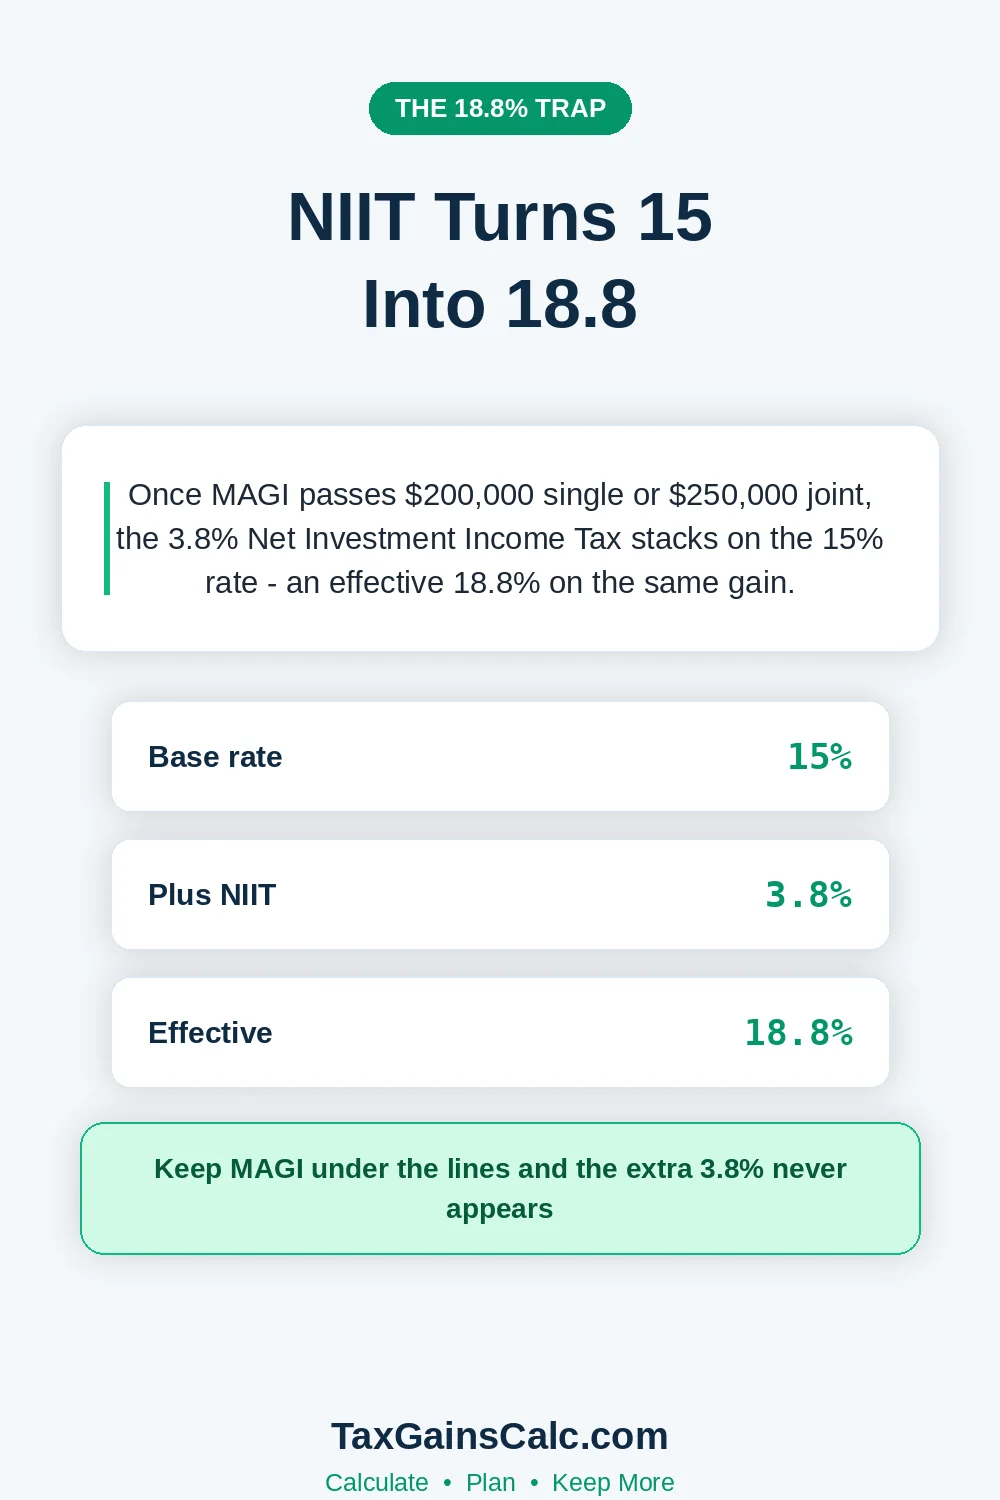
Plenty of filers who think they pay 15 percent really pay 18.8 percent once the 3.8 percent NIIT lands. The surtax applies once MAGI passes the $200,000 mark on single returns or $250,000 on joint returns.
Those thresholds sit frozen with no inflation adjustment, so every passing year pulls more filers over the line. A routine raise alone can supply the extra MAGI. Our NIIT guide explains every threshold and exception.
 One unmarried filer whose MAGI reaches $220,000 owes the full 3.8 percent surtax on gains. Every long-term dollar this filer realizes from here on carries an effective rate of 18.8 percent. The surtax sits on top of the regular band rate.
State income taxes then stack a third charge on top of whatever the IRS has already collected. Almost no state honors the federal preferential rates. Our state rates guide prices that additional layer by state.
The combined view below shows what each layer does to the same sale. That same taxpayer, carrying $220,000 of MAGI, sells the $100,000 position long-term.
All three layers land on the sale at once. The federal rate, the surtax, and the state layer each add their own share to it.
| Layer | Rate | Tax on $100,000 gain |
|---|---|---|
| federal long-term band | 15 percent | $15,000 |
| NIIT surtax | 3.8 percent | $3,800 |
| state layer (varies) | 0 to 13.3 percent | $0 to $13,300 |
| combined effective | 18.8 percent plus state | $18,800 and up |
Planning Edge One: Fill the 0 Percent Band
A low-income year opens a free harvesting window, and most investors never even notice it sitting there. The trick, of course, is spotting which years actually qualify. Retirees before Social Security and business owners between deals control their income deliberately.
Gains realized inside the 0 percent band carry a federal tax bill of exactly zero dollars. The saving is permanent, not a deferral to later years. Our zero bracket harvesting guide builds the full strategy.
The technique also pairs nicely with Roth conversions and loss harvesting in that same low-income year.
Convert IRA dollars while rates sit low, then realize gains into the free band.
Both moves inflate your reported income yet trigger no federal tax while you stay inside those bands. State rules are the catch, because many states still tax those same gains at full ordinary rates. That mismatch surprises plenty of first-time harvesters every April.
Planning Edge Two: Manage MAGI Below the NIIT Lines
Keeping MAGI below those NIIT lines spares you the whole 3.8 percent add-on. Every dollar held under the threshold escapes the surtax entirely.
Charitable contributions trim AGI, and MAGI falls right along with it, dollar for dollar. The NIIT line measures MAGI, which starts from AGI.
Donor-advised fund bunching stacks several future years of giving into one deduction you claim right now. The itemized total lands in a single year instead of trickling across several. Our DAF guide covers that bunching technique completely.
Retirement contributions, HSA contributions, and business deductions all chip away at MAGI before the NIIT test ever runs. Each one works the same way, by shrinking AGI first. When one big spike would cross a line, spreading the realization over two years usually fixes it.
 Careful account draw sequencing around those same lines keeps MAGI predictable across years. Because the NIIT tiers behave like cliffs, being off by even one dollar near a line costs real money. Model your exact MAGI figure before the tax year closes.
Planning Edge Three: Harvest at 15 Before a Future 20
If your income keeps climbing, realize the gains now while the 15 percent door still stands open. The discount only shrinks as your career advances. A sale taxed at 15 percent now beats 20 percent later after income grows.
Accelerating also restarts the holding clock on a fresh, higher-basis lot. A bigger basis means the next sale's taxable slice starts out smaller. Rising careers and growing businesses push many filers over the top boundary eventually.
Price out both years side by side before you pull any planned sale forward into the current one. Remember that state taxes belong in the comparison too. Our deferral strategies guide covers the opposite choice honestly.
Accelerating gives up the deferral benefit in exchange for the cheaper rate, and every so often that trade wins. The 20 percent boundary sits far enough up that most filers never reach it.
Why Short-Term Gains Never Get This Rate
Positions sold inside twelve months take short-term treatment at your regular income rates in nearly every situation. The ordinary brackets run from 10 percent through 37 percent at the top.
A high earner's short-term gain can cost more than double the long-term rate. Our holding period comparison prices that difference precisely.
No fund pick in your portfolio rewards you nearly as reliably as simply crossing the one-year mark. So check each purchase date before you sell any appreciated position sitting close to the anniversary. The calendar, not the market, decides the rate here.
Selling just one week past the anniversary can save thousands on an otherwise identical sale. One missed week can turn a 15 percent bill into an ordinary-rate bill. Our selling-too-early guide walks through real returns where a hasty click cost real money.
How State Taxes Stack on the 15 Percent
State income taxes apply their own rules on top of every federal layer. Nine states levy no extra tax on capital gains at all, whatever your income happens to be. The list shifts occasionally, so confirm before you count on it.
California folds gains into ordinary income and taxes them at rates reaching 13.3 percent at the top. No preferential rate exists at the state level there. Our no-tax states guide compares the full landscape.
 A 15 percent federal payer in California can face nearly 29 percent combined. Move that identical sale to Texas and the total bill stays at exactly 15 percent, full stop. No state income tax means no third layer.
Where you live moves the tax needle more than almost any fund swap you could make. Domicile rules decide which state gets to tax you.
Both extremes get modeled with worked numbers in the separate state guides here. One covers the no-tax states and the other prices the high-tax ones.
One comparison puts the whole structure in perspective before the checklist. A patient investor holding for a year plus pays 15 percent in the middle band.
An impatient neighbor selling one day before the anniversary pays full ordinary rates on every dollar instead. That single waiting period can cut the effective rate nearly in half for high earners. Patience costs nothing but a calendar and it pays at your marginal rate.
A Verification Checklist Before You File
Work through all of these checks whenever a long-term gain shows up on the return you are filing. Each check spots a common filing mistake before the IRS ever gets the chance to flag it. Thirty minutes here beats any notice letter later.
- Confirm every gain lands in the correct short-term or long-term bucket.
- Verify the slice math when a gain spans multiple bands on the worksheet.
- Check MAGI against the NIIT lines before accepting the effective rate.
- Review state treatment, because federal preferential rates rarely transfer to states.
- Confirm basis figures match your brokerage records for every disposed lot.
The IRS topic page on capital gains anchors every rate used in this article. The official 2026 inflation adjustments release confirms the band boundaries.
Investors who verify these five items file accurately at the correct effective rate. That single verification habit matters more than any planning edge described above ever will. Filers who verify these lines even once rarely face surprise bills or matching notices ever again.

Wasim Akram
Wasim researches and writes every article on TaxGainsCalc, covering capital gains tax for everyday investors. Every figure is checked against primary IRS sources before it goes live.